
The Analysis Context at the Analysis Level
Learn how the analysis context is applied when viewing an analysis.
Changing the analysis context at the analysis level
When you change the analysis context at the analysis level, the context will be applied globally to all charts in the analysis. For example, if you change the time period at the analysis level to Q4 2018, the charts in the analysis will update to display data for Q4 2018.
However, the ability to change the analysis context can be locked by the analysis author.
When viewing an analysis:
- You cannot add filters at the analysis level if the analysis author does not set a Driving Subject. The Add a filter button will not be available.
- You cannot change the time period at the analysis level if the analysis author does not set the analysis data to refresh automatically. The Time picker will not be available.
- You cannot change the time granularity at the analysis level if the analysis author does not synchronize the time picker granularity. The granularity setting that you apply at the analysis level will be ignored.
By default, the charts in an analysis will retain its local context (filters, groups, key groups, time period, and time granularity applied at the time of creation). The local context of the chart takes precedence over the context that is applied at the analysis level. If there is a conflict or overlap between the two, the context at the analysis level will not be applied.
Example: Filter at the analysis level conflicts with filter at the chart level
You're viewing an analysis that contains the following charts:
| Chart | Applied filters |
|---|---|
| Breakdown of Headcount |
|
| Breakdown of Turnover Count |
Let's say you're only interested in data for employees who are men in Canada, so you change the analysis context at the analysis level by adding the filters Gender: Man and Location: Canada.
The following table shows how the filters at the analysis level are applied to the individual charts.
| Chart | Applied filters |
|---|---|
| Breakdown of Headcount |
|
| Breakdown of Turnover Count |
|
As you can see, only the Location: Canada filter is applied to the Breakdown of Headcount. For this chart, there is a conflict between the filter at the analysis level (Gender: Man) and the filter at the chart level (Gender: Woman). As a result, the local context wins and the filter at the chart level is retained.
How filters are applied at the analysis level
An analysis can contain charts that look at multiple subjects (for example, employees, requisitions, and applicants). As a viewer, you can only filter by the subject that the analysis author sets as the Driving Subject. For example, if the Driving Subject is set to the Employee subject, you can only add filters that allow you to narrow down the employee population. This means that some filters on the analysis level may not be applied to every chart in the analysis.
Example: Adding filters at the analysis level
You're viewing an analysis that contains the following charts:
- Breakdown of Headcount by Organization
- Breakdown of Average Performance Rating by Organization
- Breakdown of Open Positions by Organization
The Driving Subject for the analysis is the Employee subject.
You want to look at data for first year employees in Marketing and Sales, so you change the analysis context by adding the following filters:
- Tenure: 0-1yr
- Organization: Marketing, Sales
If applicable, filters will be applied to all charts in the analysis at once. The following table describes how the filters are applied.
| Chart | Applied filters |
|---|---|
|
Breakdown of Headcount
|
|
| Breakdown of Average Performance Rating |
|
| Breakdown of Open Positions |
|
In this example, the analysis contains charts that look at multiple subjects. The Headcount and Average Performance metrics are based on the Employee subject while the Open Positions metric is based on the Requisition subject. The Tenure filter can only be applied to metrics that are based on the Employee subject, so the filter is dropped from the chart Breakdown of Open Positions. The Organization filter can be applied to metrics that are based on the Employee or Requisition subject, so the filter is applied to all charts in the analysis.
Note: By default, the individual charts in an analysis will retain its local context (filters that were applied at the time of creation). Any applicable filter that you apply at the analysis level will be added on top of the local context.
How the time granularity is applied at the analysis level
You cannot change the time granularity at the analysis level if the analysis author does not synchronize the time picker granularity. If this is the case, the time context for the individual charts will be determined by the local time granularity of the chart and the time period applied at the analysis level.
Example: How the time context is applied at the analysis level when the time picker granularity is not synchronized
The following charts have the following local time granularity applied:
- Weeks
- Quarters
- Years
Let's say you change the time context at the analysis level to July 2018 at a monthly granularity. The following screenshot displays how the time context is applied.
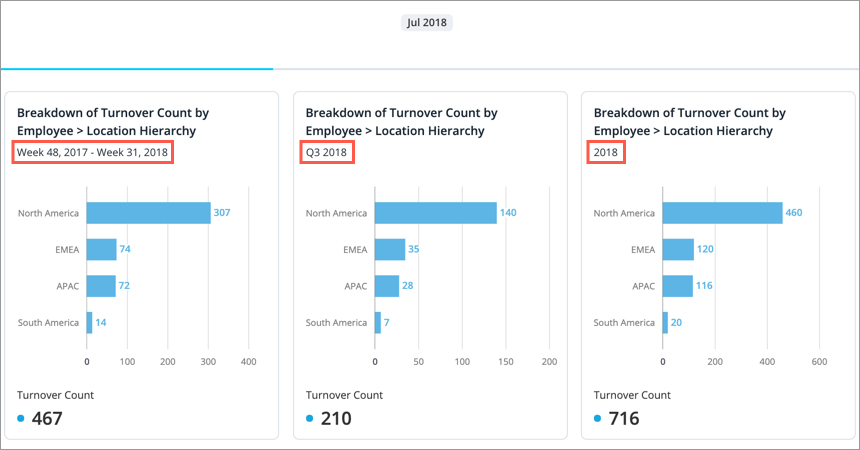
As you can see from the time context labels on the individual charts, the time granularity that you applied at the analysis level is ignored and the individual charts retain their local time granularity.
Note: Data in charts with a fixed time setting will not change when the time period or granularity of the analysis is changed, even if the analysis has the time granularity synchronized. Fixed charts will be indicated by a lock icon ![]() beside the time period. For more information, see The Time Context.
beside the time period. For more information, see The Time Context.
How the dynamic cohort time context is applied at the analysis level
If a chart is added to an analysis and it contains a cohort that is defined using a dynamic time context, the time context set at the analysis level will be used as the reference point to calculate the cohort population.
Example:
Your analysis contains a chart that shows the number of employees who started 12 months ago that are still with the organization today.
The chart contains the following time context:
The cohort definition uses a dynamic time context of 12 months ago
The local time context of the chart is December 2017
Let's say you change the time context at the analysis level to December 2019. The cohort population will be calculated relative to the time context applied at the analysis level. As a result, your cohort population will consist of employees who started in December 2018.
Note:
- The dynamic time context for cohorts will not work if the author sets the analysis data refresh setting to Time period as captured as charts will retain their local context and display data for the selected time period and granularity at which the chart was initially created.
-
The time granularity that you define when setting a dynamic time context will be used to calculate the cohort population even if the selected time granularity at the chart or analysis level is different.